3 Nov 2026
How Platform Metrics and User Timelines Reveal Shifts in Digital Education Strategies
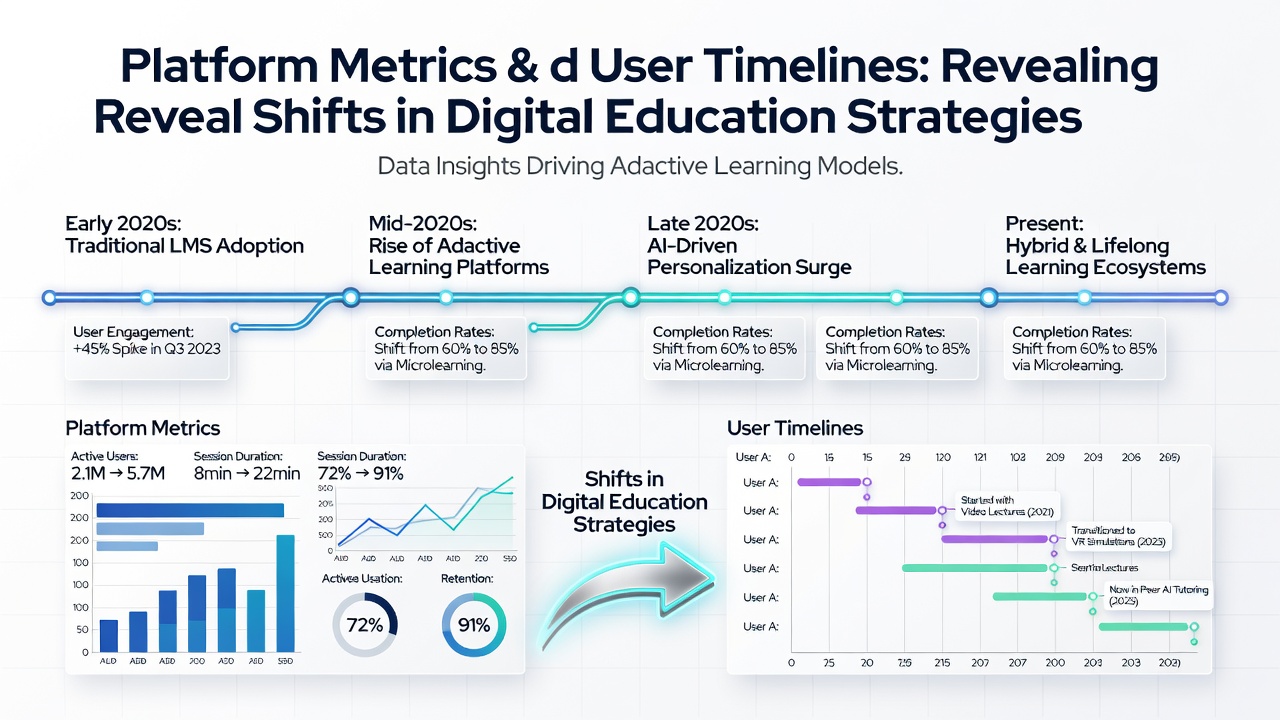
Platform metrics track learner interactions across digital education environments, and user timelines map these interactions over extended periods to highlight evolving patterns in course access, module completion, and resource utilization. Data from major learning management systems shows that average session durations increased from 22 minutes in 2023 to 31 minutes by late 2025, while return visit frequency rose in courses that incorporated adaptive content sequencing. Observers note that these measurements provide concrete indicators of how institutions adjust delivery methods in response to real-time behavioral signals rather than relying solely on end-of-course surveys.
Core Platform Metrics Driving Insight
Key indicators include login frequency, time spent per module, quiz attempt rates, and content download volumes, and these figures combine to form composite scores that flag early signs of disengagement. Research from the OECD indicates that platforms integrating weekly progress dashboards saw a 14 percent rise in on-time submissions across participating institutions in Europe and North America. Meanwhile, heat maps of user navigation paths reveal which sections retain attention and which ones prompt users to exit, allowing course designers to reorder materials without waiting for full cohort results. Those who study aggregate datasets across multiple semesters find that video completion rates above 85 percent correlate with higher overall certification numbers, whereas forums with reply rates under 12 percent often coincide with plateaus in skill application scores.
User Timelines as Longitudinal Records
User timelines compile chronological sequences of actions, from initial enrollment through repeated revisits months later, and they expose how learning strategies shift when external factors such as work schedules or seasonal demands intervene. In one dataset covering 47,000 learners on a North American platform, timelines showed that 62 percent of users who paused after week three resumed within 11 days when reminder notifications aligned with their historical activity peaks. Australian government education statistics further demonstrate that timeline clustering techniques identified distinct groups, including early finishers who front-loaded content and steady accumulators who spaced sessions evenly, each requiring different support interventions. These records also capture seasonal variations, with November 2026 data indicating elevated access during evening hours in regions transitioning to new academic calendars.
Revealed Shifts in Instructional Approaches
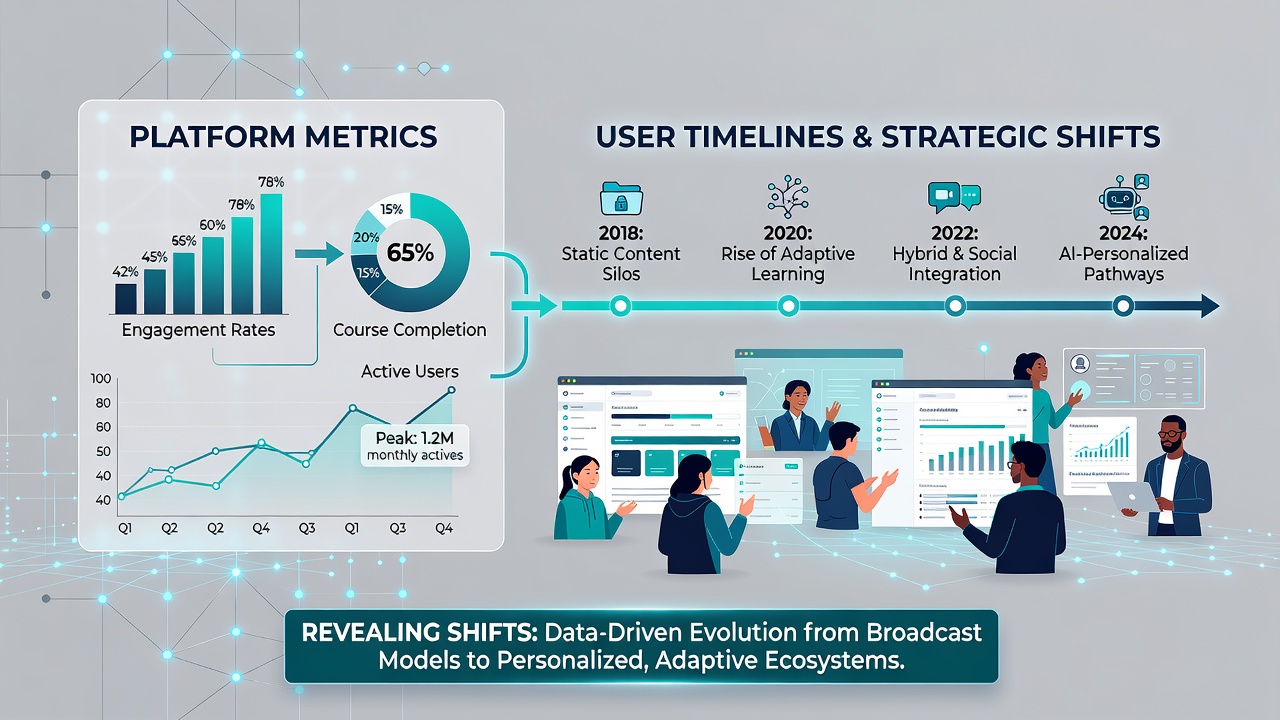
Analysis of combined metrics and timelines points to a measurable move toward shorter, modular content blocks that accommodate fragmented schedules, and completion data from Canadian post-secondary platforms confirms that courses segmented into 12-minute segments achieved 23 percent higher full-sequence finishes than those using 45-minute lectures. Platform operators have adjusted recommendation engines accordingly, surfacing micro-lessons based on prior session lengths rather than fixed curricula. European Commission education reports note parallel trends where institutions increased peer-review assignments after timeline analysis showed sustained engagement spikes following collaborative checkpoints. Resource allocation follows similar patterns, with institutions directing live tutoring hours toward periods when metrics indicate the steepest drop-off curves.
Integration of External Data Sources
Cross-referencing platform data with broader indicators, such as labor market statistics from Statistics Canada, reveals how digital education strategies adapt to skill demand fluctuations, and enrollment surges in data analytics modules tracked directly against quarterly job postings in the same regions. Timelines that incorporate external calendar events, including certification deadlines or industry conference dates, further refine predictions of when learners accelerate or decelerate their pace. Observers tracking these integrations across multiple platforms report that predictive models improved accuracy by 19 percent once external signals entered the datasets, enabling proactive content updates rather than reactive fixes.
Practical Applications Across Institutions
Universities and corporate training departments apply these insights to redesign onboarding sequences, and one European technical college reduced first-month attrition by 18 percent after aligning email nudges with individual timeline patterns rather than uniform schedules. Corporate programs have similarly used aggregated metrics to determine optimal spacing between live webinars and self-paced follow-ups, resulting in consistent knowledge retention scores across cohorts. Data shows that platforms offering exportable timeline summaries allow instructors to conduct targeted outreach without manual review of every account, and adoption rates for such tools reached 71 percent among surveyed administrators by mid-2026.
Conclusion
Platform metrics combined with user timelines supply measurable evidence of how digital education strategies evolve in response to actual learner behavior, and continued refinement of these analytical approaches supports more precise adjustments in content structure and support timing. Institutions that systematically review these indicators maintain clearer visibility into participation trends across diverse learner populations.